|
Home |
| Table of Contents |
| Place Name Index |
| Biographical Index |
| Reference Book Errors |
| Commonly Confused Words |
| U.S. Precipitation/Freeze dates |
| U.S. Plant Hardiness Zones |
| Weights and Measurements |
| Record Temps in the U.S. |
| Pinch, Dash or Smidgen |
| Multiplication Chart |
| Wind Chill Charts |
| Roman Numerals |
| 2011 Calendar |
| 2012 Calendar |
| 2013 Calendar |
| 2014 Calendar |
| 2015 Calendar |
| 2016 Calendar |
| Perpetual Calendar |
| Guide to Leap Years |
| Daylight Saving Time |
| Unusual Town Names |
| Christmas' Place Names |
| Valentine's Place Names |
| Halloween Place Names |
| Automotive Place Names |
| Bethlehem Place Names |
| California Place Names |
| Montana Place Names |
| Oregon Place Names |
| Place Names in Texas |
| Washington Place Names |
| Convict Lake, California |
| Cookietown, Oklahoma |
| Crapo, Maryland |
| Crook, Colorado |
| Devils Den, California |
| Dickshooter, Idaho |
| Hell, Michigan |
| Hopeulikit, Georgia |
| Horneytown, NC. |
| Jot 'Em Down, Texas |
| Looneyville, Texas |
| North Pole, New York |
| Tincup, Colorado |
| Truth or Consequences, NM. |
| Two Egg, Florida |
| Valentine, Nebraska |
| Warroad, Minnesota |
| Artificial Heart Invention |
| Internet Domain Extensions |
| Task Force Acronyms |
| U.S. Police Acronyms |
| Creative Acronyms |
| Police Acronyms |
| World Capitals |
| U.S. Capitals |
| U.S. Statehood |
| U.S. Presidents |
| U.S. Time Zones |
| U.S. Postage Rates |
| U.S. Mail Holidays |
| Celebrity Death Data |
| Free eBooks (A - D) |
| Free eBooks (E - Hd) |
| Free eBooks (He - Hz) |
| Free eBooks (I - L) |
| Free eBooks (M - P) |
| Free eBooks (Q - R) |
| Free eBooks (S - V) |
| Free eBooks (W - Z) |
| Frequently Asked Questions |
| Contribute Used Books |
| Sources/References |
| Recent Updates |
| Link to Us |
| Volunteer |
| Blog |
| Contact Us | |
| |
| Heat Index Charts | |
The Heat Index is an index that combines
the actual air temperature and relative humidity
to produce a "feels like" temperature. That
corresponding temperature on the heat index
(sometimes called the "apparent temperature"
or "relative outdoor temperature") approximates
what the high humidity and heat actually feels
like to the average person.
While the wintertime wind chill chart
combines the effects of low air temperatures
with wind speed to reach its "feels like"
temperature, heat index charts combine the
air temperature with humidity to attain the
summertime "feels like" temperature.
Heat Safety Tips
* Reduce, eliminate or reschedule any
strenuous activities for the coolest time
of the day.
* Dress appropriately for the summer weather.
Lightweight, light-colored clothing reflects
heat and sunlight and helps your body maintain
normal temperatures.
* Your body needs water to keep cool.
Drink plenty of water or other non-alcoholic
fluids. It becomes even more vital during
oppressively hot and humid weather that you
drink plenty of fluids, even if you don't
feel thirsty. Be certain you consult a physician
before increasing your consumption of fluids
if you are on a fluid restrictive diet, have
a fluid retention problem, or suffer from
epilepsy or heart, kidney, or liver disease.
* Always remember that heat
can be extremely dangerous to your pets
as well. NEVER leave children, the elderly
or pets in a parked car. Even on sunny, cooler
days, the temperature inside your vehicle can
skyrocket to dangerous levels in a matter
of minutes. Even at home you should ensure
your pets have a shady spot to escape the
heat.
* Stay out of the direct sun. Spend
as much time as possible in air-conditioned
locations to help reduce danger from the heat.
NOTE: Heat index charts are based on shady conditions
with light winds. Exposure to direct sunlight can
increase heat index values by as much as fifteen
degrees Fahrenheit. Although these charts focus on
dangerous heat and humidity, keep in mind that
excessive temperatures accompanied by dry air can
also be extremely hazardous. These dangers are
increased with continued exposure to the excessive
heat and/or physical activity. Elderly persons,
small children, individuals in poor health, those
on certain medications or drugs and persons with
weight and/or alcohol problems are particularly
susceptible to heat-related medical complications
or illness.
| |
| | Fahrenheit Heat Index Charts | |
The National Weather Service (NWS) developed
the heat index used to produce the charts
seen below utilizing the latest research findings
resulting from extensive biometeorological
studies.
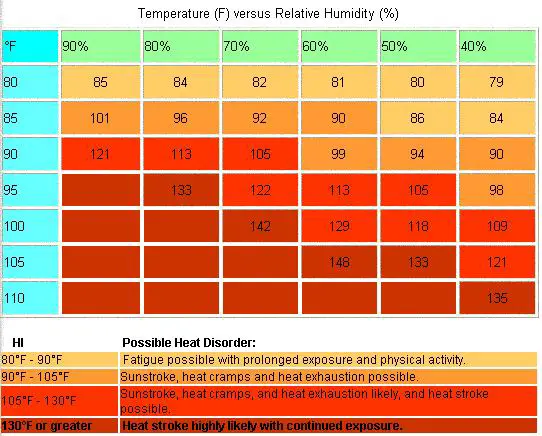
How to read the top chart
To determine the "feels like" or Heat Index
temperature, find the value closest to your
actual outside air temperature on the left.
Follow that temperature line across until
it intersects the actual relative humidity,
which is displayed at the top. The temperature
shown at the point where these two values
intersect is the Heat Index temperature.
Heat Index Chart (air temperature and relative humidity)
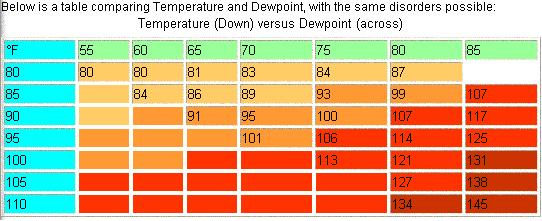
Heat Index Chart (air temperature and dewpoint)
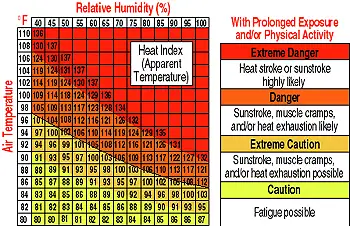
A different display of the Heat Index

A slightly different Heat Index adaptation
| |
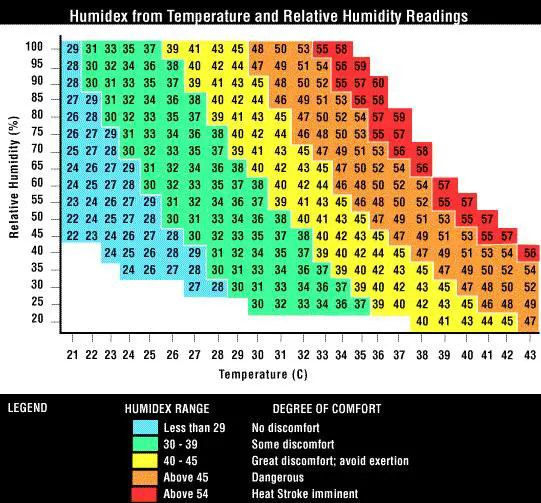
| | Humidex Table (A Celsius heat index) | |
Canadian meteorologists devised the
Celsius humidex table below, while
the U.S. National Weather Service was
responsible for developing the Fahrenheit
heat index above. The humidex table
also produces a single figure (in
degrees Celsius) that reflects how hot,
humid air actually feels. Like the
Fahrenheit charts above, this Celsius
table also displays various levels of
discomfort and potential danger.
How to read this humidex table
To determine the humidex temperature,
find the value closest to your actual
outside air temperature on the bottom.
Follow that temperature line up until
it intersects the actual relative humidity,
which is shown on the left. The temperature
shown at the point where these two values
intersect is the humidex temperature.
| |
| |
If you find the above data useful, please
link to this page from your webpage, blog or
website.
Alternatively, consider recommending us to
your friends and colleagues. Thank you in
advance! | |
Copyright © 2005-2012 INTERNET ACCURACY PROJECT. All rights reserved. All
content, is the exclusive property of Internet Accuracy Project
and may not be reproduced (on the Web, in print, or otherwise)
without the express written permission of our organization.
BY ACCESSING THIS SITE YOU ARE STATING THAT YOU AGREE TO
BE BOUND BY OUR TERMS AND CONDITIONS
regardless of whether you reside in the United States of
America or not. Our Privacy Policy.
This page was last updated January 1, 2012.
| |
| | |