|
Home |
| Table of Contents |
| Place Name Index |
| Biographical Index |
| Reference Book Errors |
| Commonly Confused Words |
| U.S. Precipitation/Freeze dates |
| U.S. Plant Hardiness Zones |
| Weights and Measurements |
| Record Temps in the U.S. |
| Pinch, Dash or Smidgen |
| Multiplication Chart |
| Heat Index Charts |
| Roman Numerals |
| 2011 Calendar |
| 2012 Calendar |
| 2013 Calendar |
| 2014 Calendar |
| 2015 Calendar |
| 2016 Calendar |
| Perpetual Calendar |
| Guide to Leap Years |
| Daylight Saving Time |
| Unusual Town Names |
| Christmas' Place Names |
| Valentine's Place Names |
| Halloween Place Names |
| Automotive Place Names |
| Bethlehem Place Names |
| California Place Names |
| Montana Place Names |
| Oregon Place Names |
| Place Names in Texas |
| Washington Place Names |
| Convict Lake, California |
| Cookietown, Oklahoma |
| Crapo, Maryland |
| Crook, Colorado |
| Devils Den, California |
| Dickshooter, Idaho |
| Hell, Michigan |
| Hopeulikit, Georgia |
| Horneytown, NC. |
| Jot 'Em Down, Texas |
| Looneyville, Texas |
| North Pole, New York |
| Tincup, Colorado |
| Truth or Consequences, NM. |
| Two Egg, Florida |
| Valentine, Nebraska |
| Warroad, Minnesota |
| Artificial Heart Invention |
| Internet Domain Extensions |
| Task Force Acronyms |
| U.S. Police Acronyms |
| Creative Acronyms |
| Police Acronyms |
| World Capitals |
| U.S. Capitals |
| U.S. Statehood |
| U.S. Presidents |
| U.S. Time Zones |
| U.S. Postage Rates |
| U.S. Mail Holidays |
| Celebrity Death Data |
| Free eBooks (A - D) |
| (E - Hd) |
| (He - Hz) |
| (I - L) |
| (M - P) |
| (Q - R) |
| (S - V) |
| (W - Z) |
| Frequently Asked Questions |
| Contribute Used Books |
| Sources/References |
| Sources of Errors |
| Recent Updates |
| Link to Us |
| Volunteer |
| Contact Us | |
| |
| Wind Chill Temperatures and Charts | |
The Wind Chill Temperature (WCT) is also known
as the "feels like" temperature and is based
on the rate of heat loss from exposed human
skin caused by the combined effects of wind
and cold. As the wind increases, the body
cools at a faster rate, causing a drop in
skin temperature and eventually the internal
body temperature.
While the summertime heat index chart
combines the effects of high air temperatures
with high humidity levels to reach its "feels
like" temperature, wind chill charts combine
the effects of low air temperatures with wind
speed to attain the wintertime "feels like"
temperature.
If precautions are not taken when
venturing outdoors, cold temperatures
and low wind chills can result in
frost bite, and lead to hypothermia.
Exposure to low wind chills can be
life threatening to both humans and
animals alike. So when going outdoors
when wind chill temperatures are low,
it is imperative that you dress in
multiple layers of warm clothing, wear
a warm hat, keep dry at all times, and
try to stay out of the wind. Although all
exposed skin should be covered, the most
vulnerable parts of the body are the
extremities such as fingers, toes, ears,
and the nose, so it is crucial that these
areas be protected from exposure to the
cold air and wind. In extreme cold, it's
best to cover your mouth to protect
your lungs from the bitter cold, and
wear a warm pair of mittens since they
offer better protection than gloves.
NOTE: The threshold for Wind Chill temperatures
is normally considered temperatures at or below
50 degrees Fahrenheit and wind speeds above 3
miles per hour. Wind Chill temperatures also
assume no impact from the sun (i.e., a clear
night sky), since bright sunshine may increase
the Wind Chill temperature by as much as 10 to
18 degrees Fahrenheit.
| |
| | Fahrenheit Wind Chill Chart | |
| |
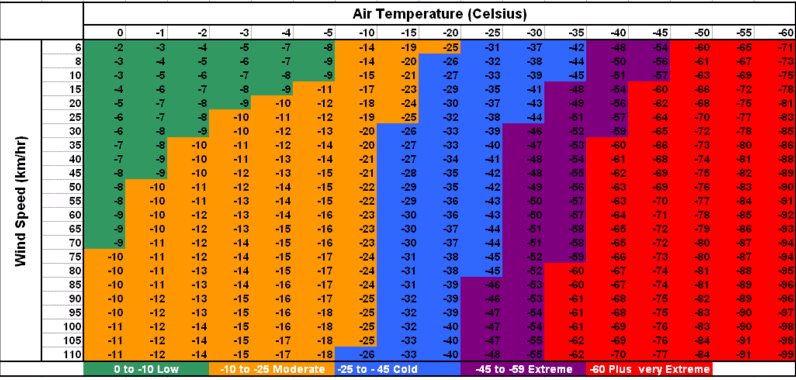
| | Celsius Wind Chill Table |
| | Temperature (degrees Celsius) |
|---|
| | 10 °C | 5 °C | 0 °C | -5 °C | -10 °C | -15 °C | -20 °C | -25 °C | -30 °C | -35 °C | -40 °C | -45 °C | -50 °C |
|---|
Wind
speed
(kph) | 10 km/h | 8.6 | 2.7 | -3.3 | -9.3 | -15.3 | -21.1 | -27.2 | -33.2 | -39.2 | -45.1 | -51.1 | -57.1 | -63.0 |
|---|
| 15 km/h | 7.9 | 1.7 | -4.4 | -10.6 | -16.7 | -22.9 | -29.1 | -35.2 | -41.4 | -47.6 | -53.7 | -59.9 | -66.1 |
|---|
| 20 km/h | 7.4 | 1.1 | -5.2 | -11.6 | -17.9 | -24.2 | -30.5 | -36.8 | -43.1 | -49.4 | -55.7 | -62.0 | -68.3 |
|---|
| 25 km/h | 6.9 | 0.5 | -5.9 | -12.3 | -18.8 | -25.2 | -31.6 | -38.0 | -44.5 | -50.9 | -57.3 | -63.7 | -70.2 |
|---|
| 30 km/h | 6.6 | 0.1 | -6.5 | -13.0 | -19.5 | -26.0 | -32.6 | -39.1 | -45.6 | -52.1 | -58.7 | -65.2 | -71.7 |
|---|
| 35 km/h | 6.3 | -0.4 | -7.0 | -13.6 | -20.2 | -26.8 | -33.4 | -40.0 | -46.6 | -53.2 | -59.8 | -66.4 | -73.1 |
|---|
| 40 km/h | 6.0 | -0.7 | -7.4 | -14.1 | -20.8 | -27.4 | -34.1 | -40.8 | -47.5 | -54.2 | -60.9 | -67.6 | -74.2 |
|---|
| 45 km/h | 5.7 | -1.0 | -7.8 | -14.5 | -21.3 | -28.0 | -34.8 | -41.5 | -48.3 | -55.1 | -61.8 | -68.6 | -75.3 |
|---|
| 50 km/h | 5.5 | -1.3 | -8.1 | -15.0 | -21.8 | -28.6 | -35.4 | -42.2 | -49.0 | -55.8 | -62.7 | -69.5 | -76.3 |
|---|
| 55 km/h | 5.3 | -1.6 | -8.5 | -15.3 | -22.2 | -29.1 | -36.0 | -42.8 | -49.7 | -56.6 | -63.4 | -70.3 | -77.2 |
|---|
| 60 km/h | 5.1 | -1.8 | -8.8 | -15.7 | -22.6 | -29.5
| -36.5 | -43.4 | -50.3 | -57.2 | -64.2 | -71.1 | -78.0 |
|---|
Celsius Wind Chill Chart
| |
| | Temperature Conversion Between Celsius and Fahrenheit |
°Celsius = (°Fahrenheit - 32) ÷ 1.8
°Fahrenheit = (°Celsius x 1.8) + 32
| Condition |
Fahrenheit |
Celsius |
| Boiling point of water |
212° |
100° |
| A very hot day |
104° |
40° |
| Normal body temperature |
98.6° |
37° |
| A very warm day |
86° |
30° |
| A mild day |
68° |
20° |
| A cool day |
50° |
10° |
| Freezing point of water |
32° |
0° |
| Temperature
Conversion |
| Celsius |
Fahrenheit |
|
Celsius |
Fahrenheit |
|
Celsius |
Fahrenheit |
0
1
2
3
4
5
6
7
8
9
10
11
12
13
14
15
16
17
18
19
20
|
32.0
33.8
35.6
37.4
39.2
41.0
42.8
44.6
46.4
48.2
50.0
51.8
53.6
55.4
57.2
59.0
60.8
62.6
64.4
66.2
68.0
|
|
21
22
23
24
25
26
27
28
29
30
33
32
33
34
35
36
37
38
39
40
41
|
69.8
71.6
73.4
75.2
77.0
78.8
80.6
82.4
84.2
86.0
87.8
89.6
91.4
93.2
95.0
96.8
98.6
100.4
102.2
104.0
105.8
|
|
42
43
44
45
46
47
48
49
50
55
52
53
54
55
56
57
58
59
60
100
|
107.6
109.4
111.2
113.0
114.8
116.6
118.4
120.2
122.0
123.8
125.6
127.4
129.2
131.0
132.8
134.6
136.4
138.2
140.0
212
|
| |
| | OLD Wind Chill Chart (In use until 2001) | |
In 2000, the National Weather Service brought
together a large group of experts to revise the
old Wind Chill Chart that was found to offer
inaccurate wind chill values that were often
far lower than they should have been. The
large number of wind chill temperatures in
excess of 100 below zero found on the lower
right side of the chart below, illustrates
that very point. The former WCT Index utilized
by the National Weather Service in the United
States and the Meteorological Services of
Canada, was based on the outdated Siple and
Passel Index that dated back to 1945.
Extensive clinical trials were undertaken
to help develop a more accurate formula
to calculate how wind-blown cold air feels
on human skin and determine frostbite
threshold values. The end result is a
Wind Chill Temperature Index that is more
accurate, understandable and useful in
determining the dangers from wind coupled
with cold temperatures. The new Wind Chill
Chart is presented above, while the old
Wind Chill Chart -- in use until late in
2001 -- is shown below.
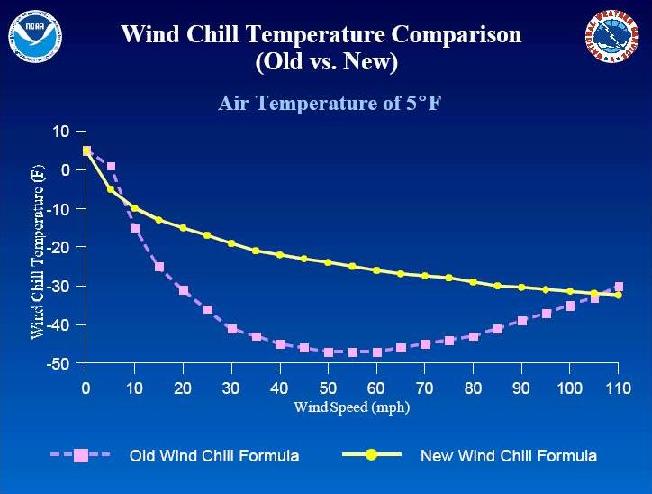
This Wind Chill Temperature comparison chart
contrasts the old Wind Chill formula with the new.
| |
| |
If you find the above data useful, please
link to this page from your webpage, blog or
website.
Alternatively, consider recommending us to
your friends and colleagues. Thank you in
advance! | |
Copyright © 2005-2012 INTERNET ACCURACY PROJECT. All rights reserved. All
content, is the exclusive property of Internet Accuracy Project
and may not be reproduced (on the Web, in print, or otherwise)
without the express written permission of our organization.
BY ACCESSING THIS SITE YOU ARE STATING THAT YOU AGREE TO
BE BOUND BY OUR TERMS AND CONDITIONS
regardless of whether you reside in the United States of
America or not. Our Privacy Policy.
This page was last updated January 1, 2012.
| |
| | |